Changelog
Changelog
Discover the latest features in the Aptible product.
Discover the latest features in the Aptible product.
Mar 25, 2025
During more complex incidents, on-call engineers frequently struggle to pinpoint a root cause. In order to support these larger incidents, we’ve improved Aptible AI’s diagnostics workflow to be able to expand your search and run multiple queries in parallel for those big deployments.
Enhanced diagnostics workflow
Multi-stage investigations: For larger incidents, you can now start with a single resource (like an app or database), and incrementally expand your search.
Parallel AI queries: Under the hood, we’ve reworked how the agent pulls data. It can now safely run multiple queries concurrently, returning results faster for big deployments.
We look forward to sharing more as we continue refining Aptible AI to deliver faster incident resolution and more actionable insights. As always, thank you for your feedback and partnership in shaping the future of Aptible!
Mar 25, 2025
During more complex incidents, on-call engineers frequently struggle to pinpoint a root cause. In order to support these larger incidents, we’ve improved Aptible AI’s diagnostics workflow to be able to expand your search and run multiple queries in parallel for those big deployments.
Enhanced diagnostics workflow
Multi-stage investigations: For larger incidents, you can now start with a single resource (like an app or database), and incrementally expand your search.
Parallel AI queries: Under the hood, we’ve reworked how the agent pulls data. It can now safely run multiple queries concurrently, returning results faster for big deployments.
We look forward to sharing more as we continue refining Aptible AI to deliver faster incident resolution and more actionable insights. As always, thank you for your feedback and partnership in shaping the future of Aptible!
Mar 25, 2025
Mar 14, 2025
Expanding on our pre-existing knowledge graph foundation, we’re rolling out two major features to help unify your environment data:
Service Catalog
Built from integrations: Aptible can construct a service catalog from your existing platform and observability providers. No more guesswork about who owns what in a microservice architecture.
Custom queries interface
Customize the queries we use when troubleshooting: From the new integrations page in the UI, you can define custom queries for your logs or metrics.
Multi-provider support: Whether you use Papertrail or CloudWatch, set up queries that retrieve exactly what you need during an investigation.
With these updates, we’re continuing to bridge the gap between distributed teams and the real-time data they need.
Mar 14, 2025
Expanding on our pre-existing knowledge graph foundation, we’re rolling out two major features to help unify your environment data:
Service Catalog
Built from integrations: Aptible can construct a service catalog from your existing platform and observability providers. No more guesswork about who owns what in a microservice architecture.
Custom queries interface
Customize the queries we use when troubleshooting: From the new integrations page in the UI, you can define custom queries for your logs or metrics.
Multi-provider support: Whether you use Papertrail or CloudWatch, set up queries that retrieve exactly what you need during an investigation.
With these updates, we’re continuing to bridge the gap between distributed teams and the real-time data they need.
Mar 14, 2025
Feb 28, 2025
On-call engineers are not only racing against the clock, but they’re also facing a whole sea of logs and metrics that they have to sift through to determine root cause. That’s why we’ve prioritized features that focus on speeding up root cause analysis (RCA) by helping you see only the most relevant information:
Anomaly grouping and surfacing
New Observations Panel: Within the Diagnostics Dashboard, we’ve introduced a condensed “Observations Panel” that filters out extraneous data and highlights anomalies.
Time-range drilling: Quickly adjust the time window on your dashboards to hone in on suspicious metric spikes or unusual log entries.
Smarter summaries for on-call: Instead of just listing all the anomalies, the system now composes a brief summary of potential root causes—especially useful for on-call engineers who are less familiar with certain services.
Between the new Observations Panel and AI summaries, we aim to get you from alert → root cause even faster.
Feb 28, 2025
On-call engineers are not only racing against the clock, but they’re also facing a whole sea of logs and metrics that they have to sift through to determine root cause. That’s why we’ve prioritized features that focus on speeding up root cause analysis (RCA) by helping you see only the most relevant information:
Anomaly grouping and surfacing
New Observations Panel: Within the Diagnostics Dashboard, we’ve introduced a condensed “Observations Panel” that filters out extraneous data and highlights anomalies.
Time-range drilling: Quickly adjust the time window on your dashboards to hone in on suspicious metric spikes or unusual log entries.
Smarter summaries for on-call: Instead of just listing all the anomalies, the system now composes a brief summary of potential root causes—especially useful for on-call engineers who are less familiar with certain services.
Between the new Observations Panel and AI summaries, we aim to get you from alert → root cause even faster.
Feb 28, 2025
Feb 8, 2025
Most companies nowadays face challenges with infrastructure complexity and tool sprawl, particularly when it comes to incident response. When on-call engineers get alerted about a production issue, it can often be difficult to pinpoint where the issue originated and how to resolve it. To help with these problems, we’ve launched several new integrations as well as a refresh of Aptible AI’s knowledge graph capabilities.
New and improved integrations
Datadog, CloudWatch, and beyond: We’ve built out specialized connectors for these observability platforms, letting you import key metrics and logs in near-real-time.
Custom resource support: For teams with unique internal systems, we now support modeling custom resources in the knowledge graph. This means you can attach your homegrown monitoring data or script outputs directly to the same dashboards you use for commercial tooling.
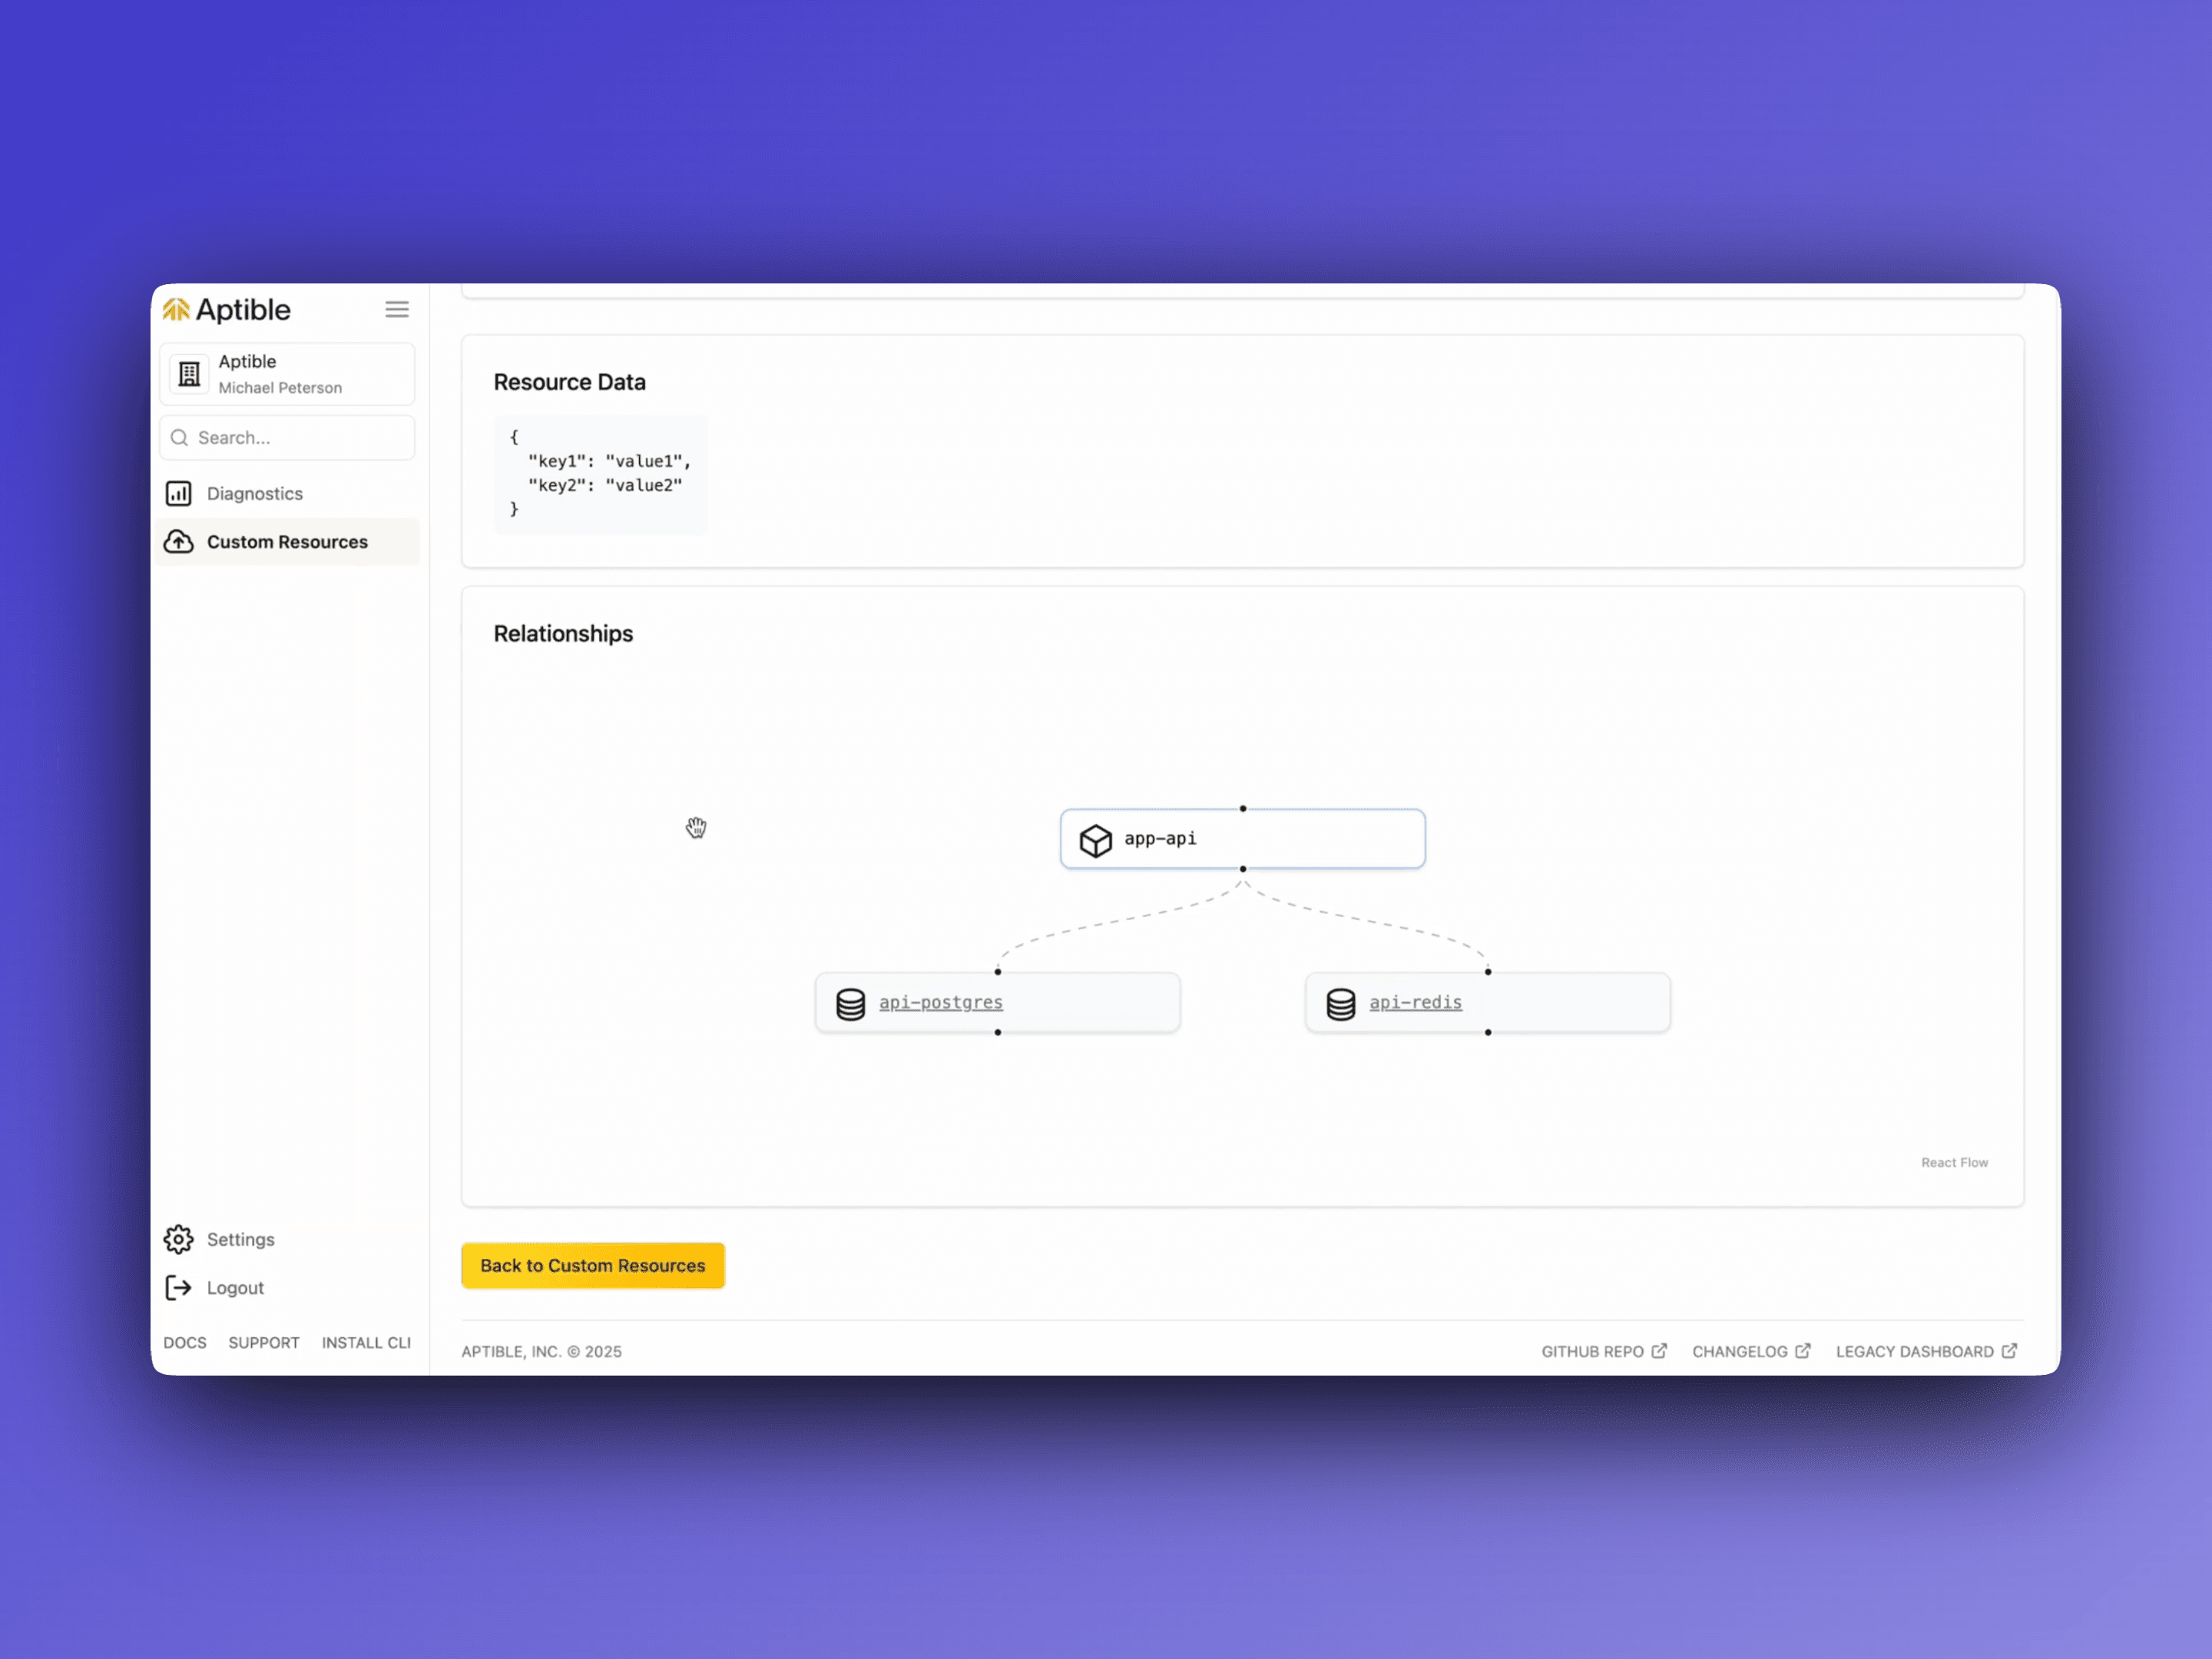
Knowledge graph refresh
Periodic edge updates: We’ve deployed a background job that regularly refreshes resource relationships. If you add or remove a service or environment variable, the knowledge graph automatically reflects it.
Deeper service context: We now annotate edges with relationship metadata metadata to help the AI better understand how your services connect—and highlight those connections in your diagnostic dashboards.
Most companies nowadays face challenges with infrastructure complexity and tool sprawl, particularly when it comes to incident response. When on-call engineers get alerted about a production issue, it can often be difficult to pinpoint where the issue originated and how to resolve it. To help with these problems, we’ve launched several new integrations as well as a refresh of Aptible AI’s knowledge graph capabilities.
New and improved integrations
Datadog, CloudWatch, and beyond: We’ve built out specialized connectors for these observability platforms, letting you import key metrics and logs in near-real-time.
Custom resource support: For teams with unique internal systems, we now support modeling custom resources in the knowledge graph. This means you can attach your homegrown monitoring data or script outputs directly to the same dashboards you use for commercial tooling.
Knowledge graph refresh
Periodic edge updates: We’ve deployed a background job that regularly refreshes resource relationships. If you add or remove a service or environment variable, the knowledge graph automatically reflects it.
Deeper service context: We now annotate edges with relationship metadata metadata to help the AI better understand how your services connect—and highlight those connections in your diagnostic dashboards.
Feb 8, 2025
Most companies nowadays face challenges with infrastructure complexity and tool sprawl, particularly when it comes to incident response. When on-call engineers get alerted about a production issue, it can often be difficult to pinpoint where the issue originated and how to resolve it. To help with these problems, we’ve launched several new integrations as well as a refresh of Aptible AI’s knowledge graph capabilities.
New and improved integrations
Datadog, CloudWatch, and beyond: We’ve built out specialized connectors for these observability platforms, letting you import key metrics and logs in near-real-time.
Custom resource support: For teams with unique internal systems, we now support modeling custom resources in the knowledge graph. This means you can attach your homegrown monitoring data or script outputs directly to the same dashboards you use for commercial tooling.
Knowledge graph refresh
Periodic edge updates: We’ve deployed a background job that regularly refreshes resource relationships. If you add or remove a service or environment variable, the knowledge graph automatically reflects it.
Deeper service context: We now annotate edges with relationship metadata metadata to help the AI better understand how your services connect—and highlight those connections in your diagnostic dashboards.
Feb 8, 2025
Jan 29, 2025
You have a sea of metrics and hundreds of historical incidents, anomalies, and root causes. When metrics become too overwhelming, we might decide to just ignore them rather than use them to our advantage 🥴 With the latest release, Aptible AI now supports incident correlation that helps your team figure out what really matters among all the noise.
Incident correlation
Automated anomaly grouping: We use signal processing under the hood to detect anomalies in each metric, then cluster them when they appear at similar times. Instead of scanning through hundreds of plots, you’ll get a highlight reel of what’s truly significant.
Root cause suggestions: Our AI now references these clusters when proposing next steps, giving on-call engineers a head start on the probable source of an issue.
These enhancements continue to build our vision of an automated root cause analysis platform, so your team has fewer interruptions and more reliable insights.
Jan 29, 2025
You have a sea of metrics and hundreds of historical incidents, anomalies, and root causes. When metrics become too overwhelming, we might decide to just ignore them rather than use them to our advantage 🥴 With the latest release, Aptible AI now supports incident correlation that helps your team figure out what really matters among all the noise.
Incident correlation
Automated anomaly grouping: We use signal processing under the hood to detect anomalies in each metric, then cluster them when they appear at similar times. Instead of scanning through hundreds of plots, you’ll get a highlight reel of what’s truly significant.
Root cause suggestions: Our AI now references these clusters when proposing next steps, giving on-call engineers a head start on the probable source of an issue.
These enhancements continue to build our vision of an automated root cause analysis platform, so your team has fewer interruptions and more reliable insights.
Jan 29, 2025
Jan 11, 2025
The first wave of Aptible AI functionality has gone live 🎉 here’s what’s new:
Diagnostics Dashboards
Incident summaries in one place: Whenever an incident is reported (via an alert or manually), Aptible automatically produces a Dashboard that gathers relevant metrics, logs, and runbook references.
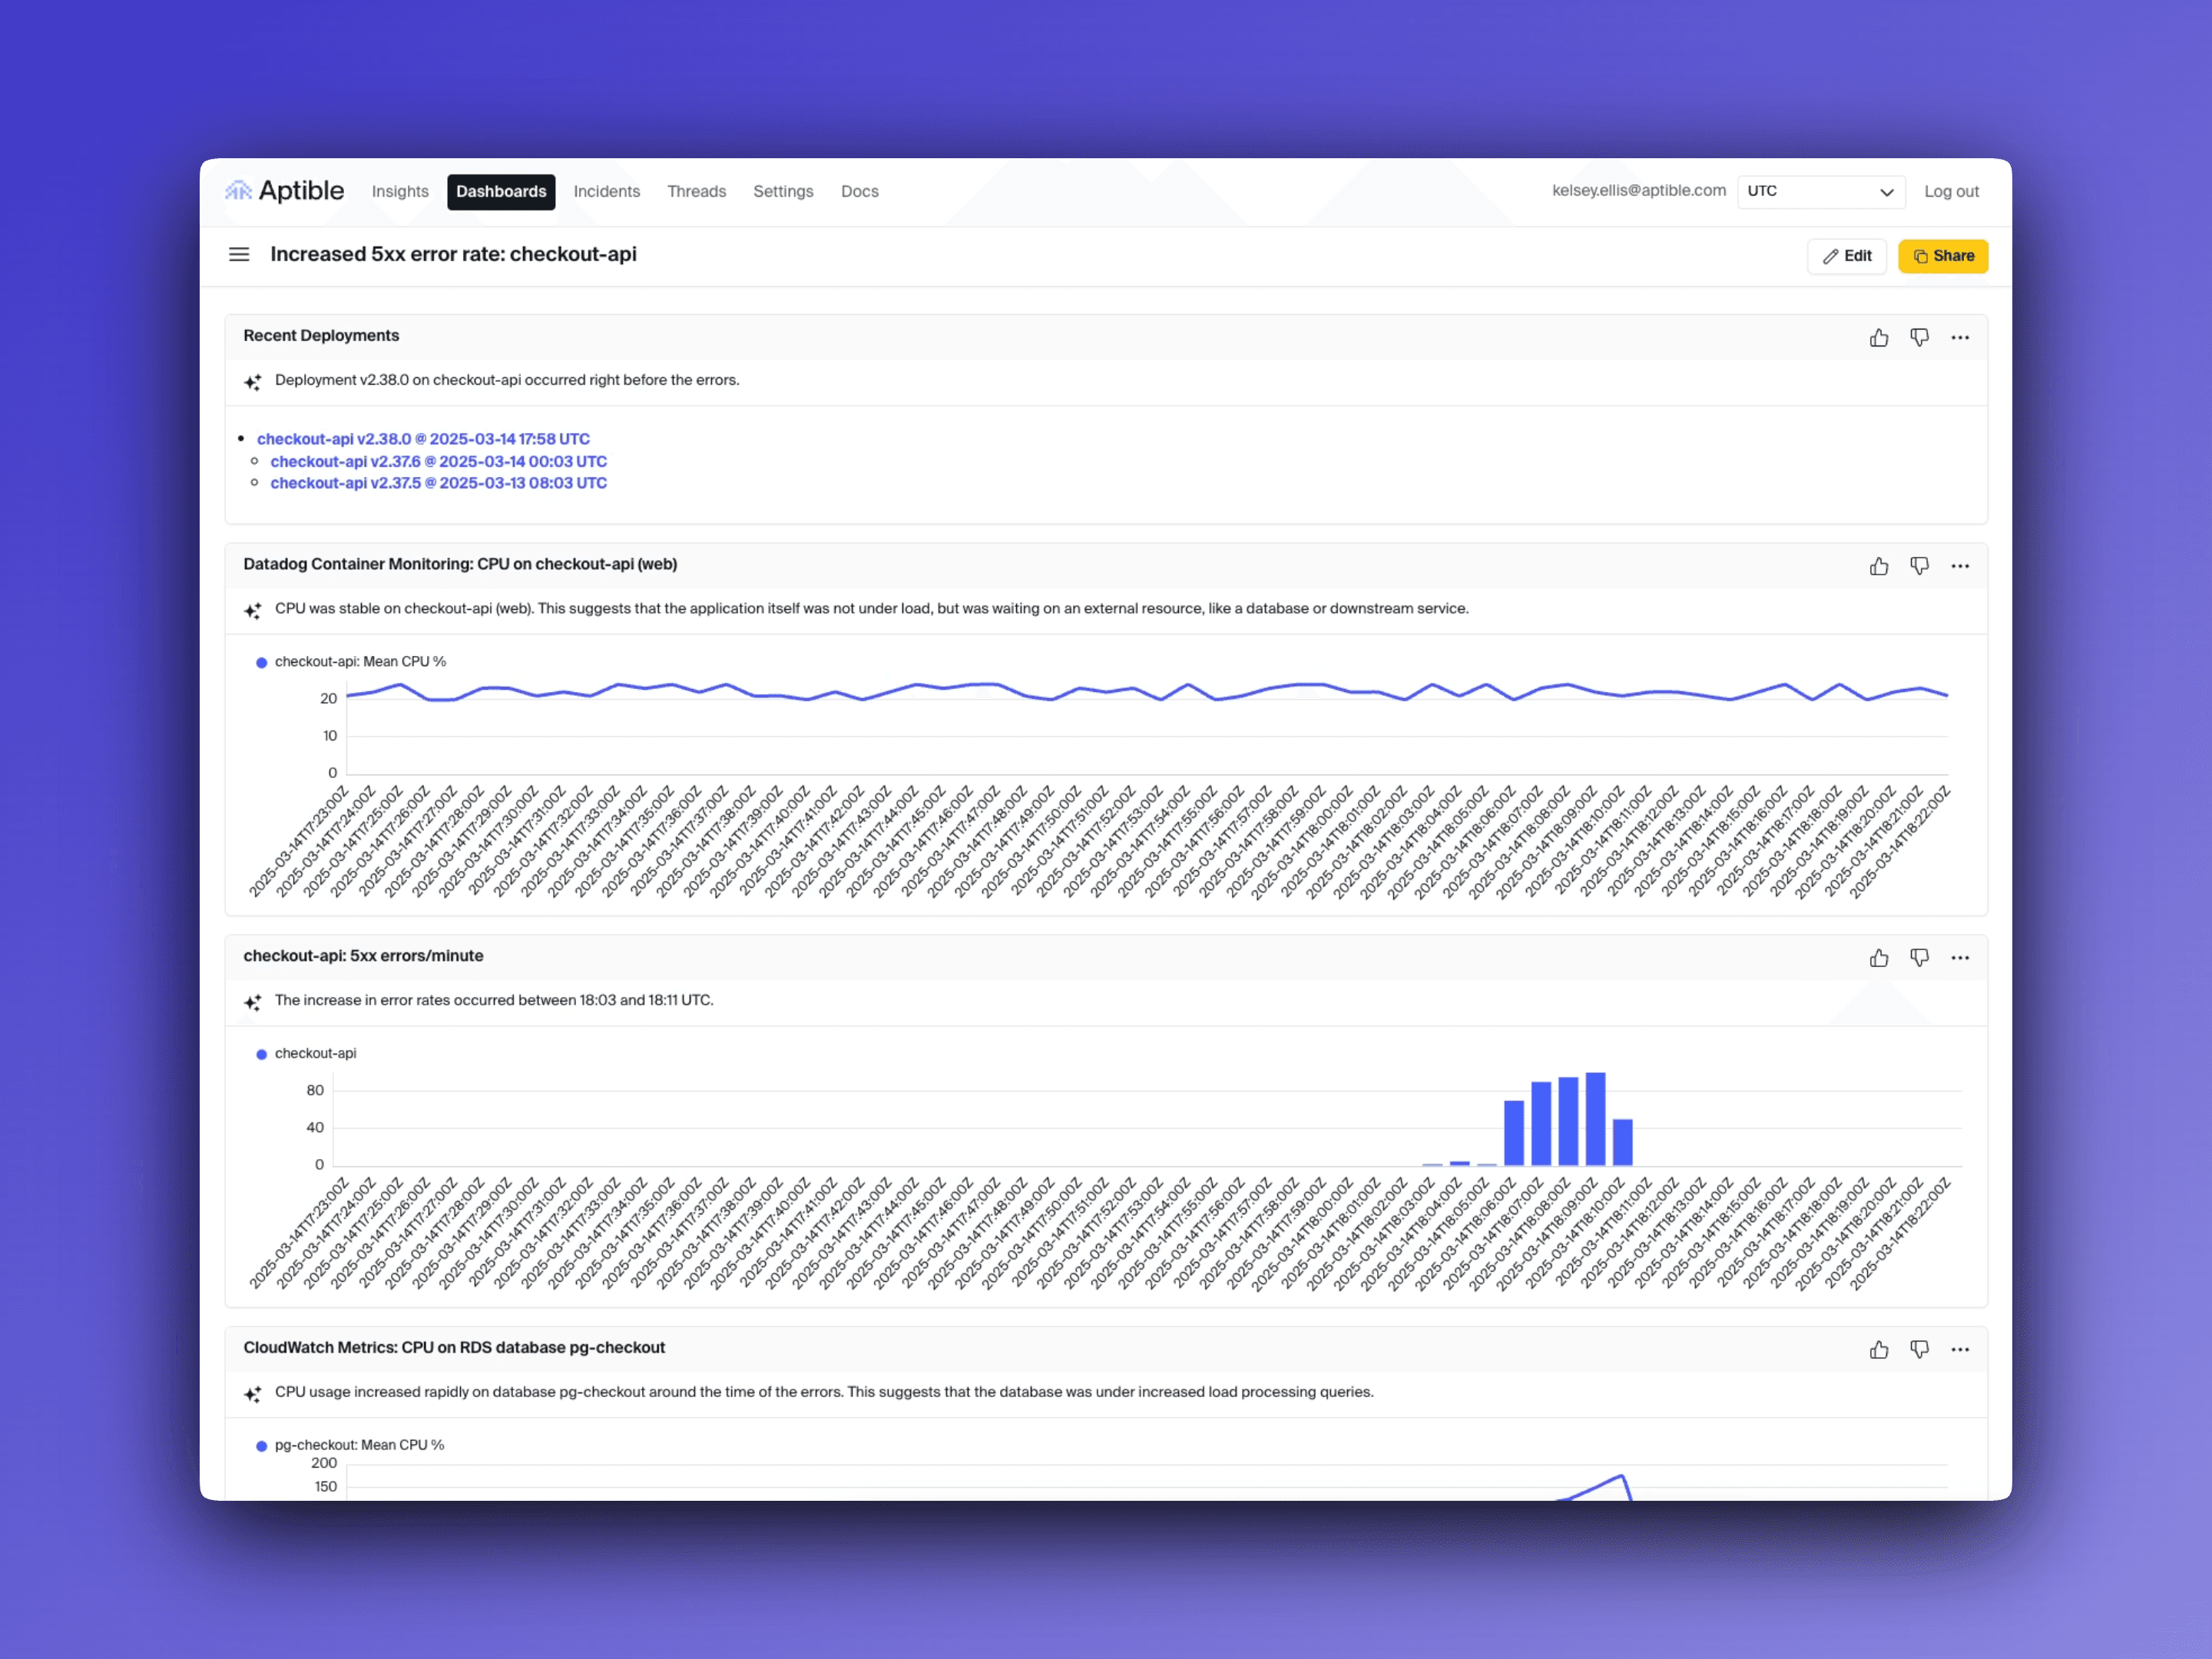
Persisted and shareable: Each Dashboard is saved by default, allowing teams to revisit them, share them internally, and easily see prior investigations for the same service.
Unified observations & knowledge graph
Dependency insights: Our knowledge graph now includes external resources from third-party tools. This means you’ll see how internal microservices connect to external APIs, cloud resources, or other integrations.
Historical observations: We’ve started collecting and storing logs, metrics, and other investigation data in our knowledge graph, making it easier for the AI to identify problematic services earlier, and more intelligently probe for issues.
Early feedback
Our design partners (including some new POC participants 😎) report that it’s much easier for on-call engineers with less context to understand how a service is connected to everything else.
Senior engineers say the Diagnostics Dashboards help them skip repetitive data fetching and get to the real root cause faster.
The first wave of Aptible AI functionality has gone live 🎉 here’s what’s new:
Diagnostics Dashboards
Incident summaries in one place: Whenever an incident is reported (via an alert or manually), Aptible automatically produces a Dashboard that gathers relevant metrics, logs, and runbook references.
Persisted and shareable: Each Dashboard is saved by default, allowing teams to revisit them, share them internally, and easily see prior investigations for the same service.
Unified observations & knowledge graph
Dependency insights: Our knowledge graph now includes external resources from third-party tools. This means you’ll see how internal microservices connect to external APIs, cloud resources, or other integrations.
Historical observations: We’ve started collecting and storing logs, metrics, and other investigation data in our knowledge graph, making it easier for the AI to identify problematic services earlier, and more intelligently probe for issues.
Early feedback
Our design partners (including some new POC participants 😎) report that it’s much easier for on-call engineers with less context to understand how a service is connected to everything else.
Senior engineers say the Diagnostics Dashboards help them skip repetitive data fetching and get to the real root cause faster.
Jan 11, 2025
The first wave of Aptible AI functionality has gone live 🎉 here’s what’s new:
Diagnostics Dashboards
Incident summaries in one place: Whenever an incident is reported (via an alert or manually), Aptible automatically produces a Dashboard that gathers relevant metrics, logs, and runbook references.
Persisted and shareable: Each Dashboard is saved by default, allowing teams to revisit them, share them internally, and easily see prior investigations for the same service.
Unified observations & knowledge graph
Dependency insights: Our knowledge graph now includes external resources from third-party tools. This means you’ll see how internal microservices connect to external APIs, cloud resources, or other integrations.
Historical observations: We’ve started collecting and storing logs, metrics, and other investigation data in our knowledge graph, making it easier for the AI to identify problematic services earlier, and more intelligently probe for issues.
Early feedback
Our design partners (including some new POC participants 😎) report that it’s much easier for on-call engineers with less context to understand how a service is connected to everything else.
Senior engineers say the Diagnostics Dashboards help them skip repetitive data fetching and get to the real root cause faster.
Jan 11, 2025
Jan 3, 2025
One thing our customers have always loved about Aptible is our reliability. But that doesn’t come for free — we have an experienced team of SREs and a hardened infrastructure that keeps our customers’ instances online.
We hear a lot from companies not running on Aptible that incident response is difficult for on-call engineers. And while we empathize, we also recognize the strength of the systems we’ve built to ensure high availability. One tool we’ve had a ton of success with recently is an AI Agent that eliminates initial investigation steps.
Our team has been utilizing this tool during incidents to automate root cause analysis, and now we’re developing it further so that any company can use it, regardless of where they’re hosted.
So today we’re announcing a new Aptible product designed to address the overwhelming challenges of incident management: Aptible AI.
We view Aptible AI as the next step in Aptible's journey to simplify cloud infrastructure for every developer at every company; this step is particularly designed to help SRE teams quickly diagnose and remediate critical issues in production.
Why now?
Over the past year, we’ve learned that while “just-in-time AI assistance” can be helpful, what teams really need is a holistic incident management solution that centralizes alerts, correlates data from multiple observability tools, and automates root cause analysis. To that end, we’ve reoriented our AI features around:
Diagnostics Dashboards: Interactive dashboards that pull relevant logs, metrics, and known dependencies into a single view.
Knowledge graph-powered correlations: An internal mapping of services and resources that helps highlight anomalies spanning multiple domains.
AI-Driven suggestions: Once an issue is identified, our AI Agent can provide next-step guidance and recommended runbooks.
Stay tuned for more updates on how these features work together to reduce downtime and engineering burnout by keeping on-call engineers from drowning in alerts and endless root cause investigations.
Jan 3, 2025
One thing our customers have always loved about Aptible is our reliability. But that doesn’t come for free — we have an experienced team of SREs and a hardened infrastructure that keeps our customers’ instances online.
We hear a lot from companies not running on Aptible that incident response is difficult for on-call engineers. And while we empathize, we also recognize the strength of the systems we’ve built to ensure high availability. One tool we’ve had a ton of success with recently is an AI Agent that eliminates initial investigation steps.
Our team has been utilizing this tool during incidents to automate root cause analysis, and now we’re developing it further so that any company can use it, regardless of where they’re hosted.
So today we’re announcing a new Aptible product designed to address the overwhelming challenges of incident management: Aptible AI.
We view Aptible AI as the next step in Aptible's journey to simplify cloud infrastructure for every developer at every company; this step is particularly designed to help SRE teams quickly diagnose and remediate critical issues in production.
Why now?
Over the past year, we’ve learned that while “just-in-time AI assistance” can be helpful, what teams really need is a holistic incident management solution that centralizes alerts, correlates data from multiple observability tools, and automates root cause analysis. To that end, we’ve reoriented our AI features around:
Diagnostics Dashboards: Interactive dashboards that pull relevant logs, metrics, and known dependencies into a single view.
Knowledge graph-powered correlations: An internal mapping of services and resources that helps highlight anomalies spanning multiple domains.
AI-Driven suggestions: Once an issue is identified, our AI Agent can provide next-step guidance and recommended runbooks.
Stay tuned for more updates on how these features work together to reduce downtime and engineering burnout by keeping on-call engineers from drowning in alerts and endless root cause investigations.
Jan 3, 2025