Jan 11, 2025
Diagnostics dashboards and unified observations
The first wave of Aptible AI functionality has gone live 🎉 here’s what’s new:
Diagnostics Dashboards
Incident summaries in one place: Whenever an incident is reported (via an alert or manually), Aptible automatically produces a Dashboard that gathers relevant metrics, logs, and runbook references.
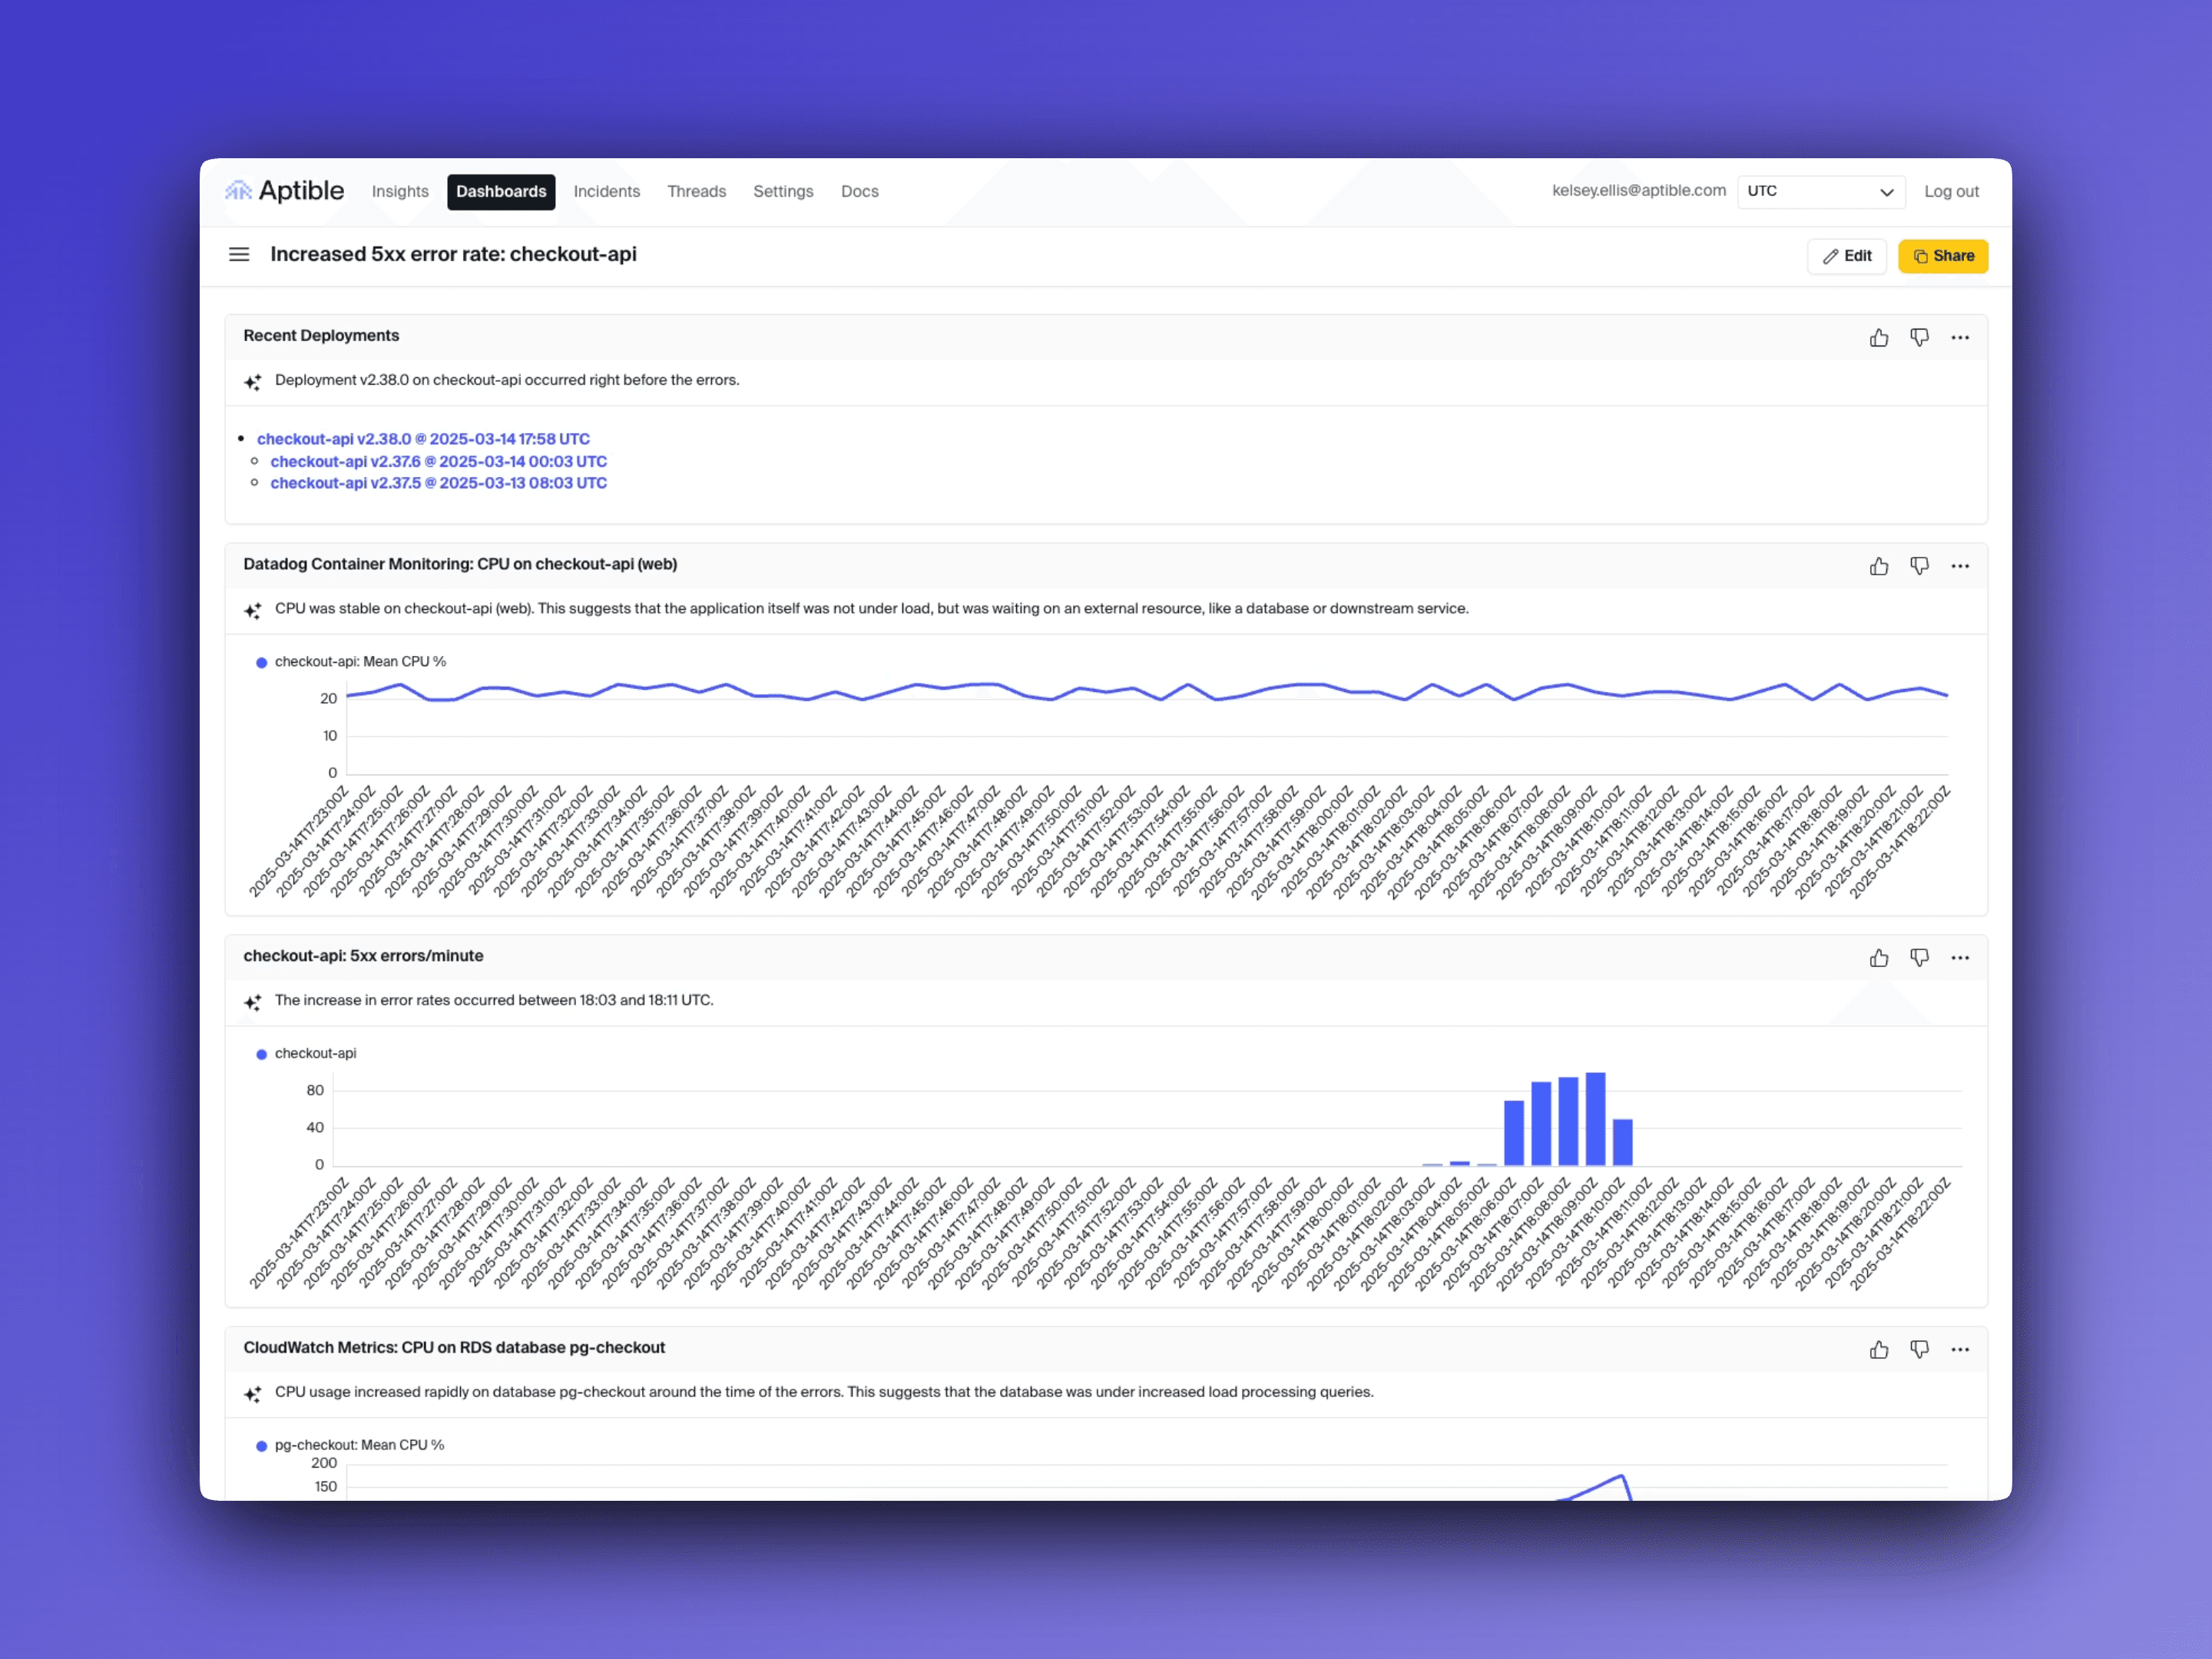
Persisted and shareable: Each Dashboard is saved by default, allowing teams to revisit them, share them internally, and easily see prior investigations for the same service.
Unified observations & knowledge graph
Dependency insights: Our knowledge graph now includes external resources from third-party tools. This means you’ll see how internal microservices connect to external APIs, cloud resources, or other integrations.
Historical observations: We’ve started collecting and storing logs, metrics, and other investigation data in our knowledge graph, making it easier for the AI to identify problematic services earlier, and more intelligently probe for issues.
Early feedback
Our design partners (including some new POC participants 😎) report that it’s much easier for on-call engineers with less context to understand how a service is connected to everything else.
Senior engineers say the Diagnostics Dashboards help them skip repetitive data fetching and get to the real root cause faster.